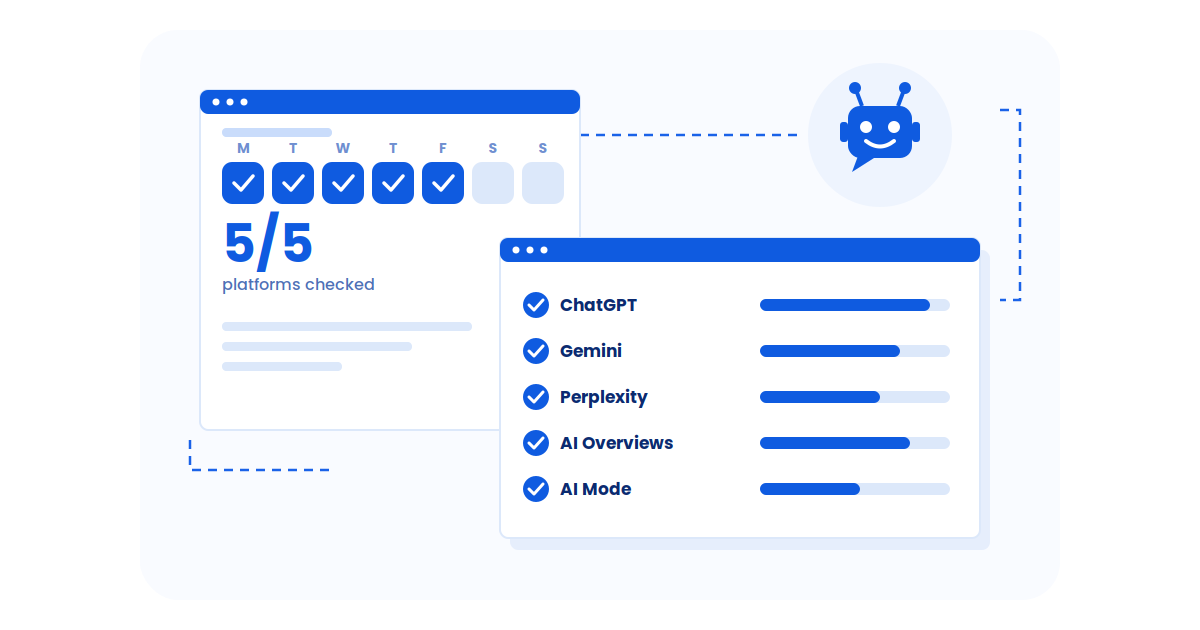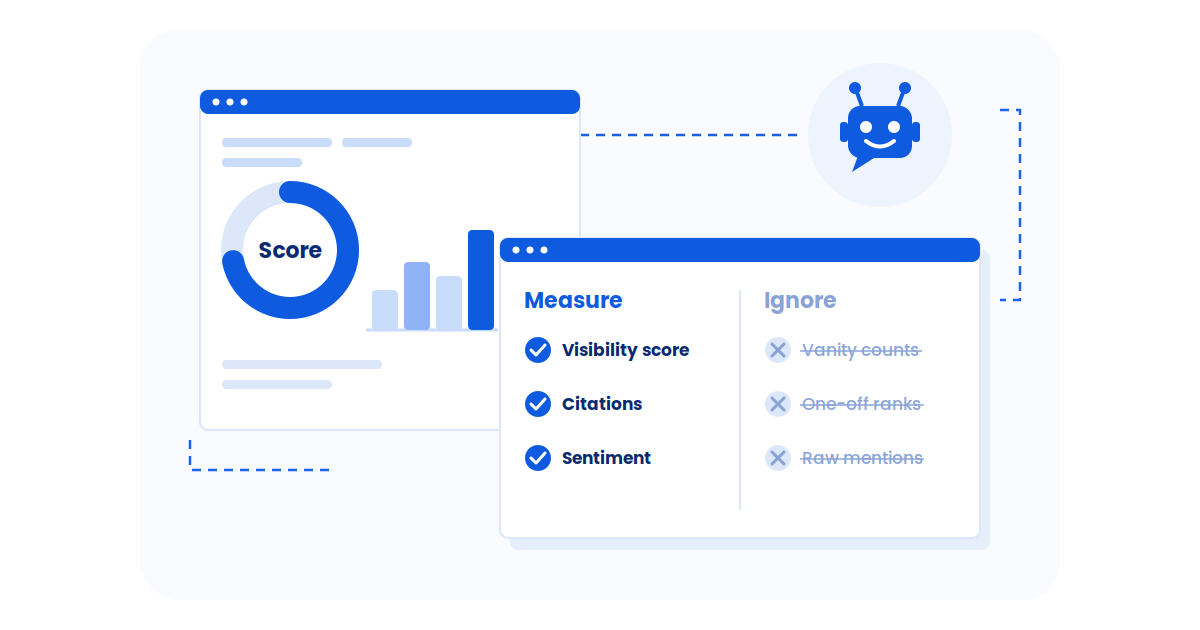
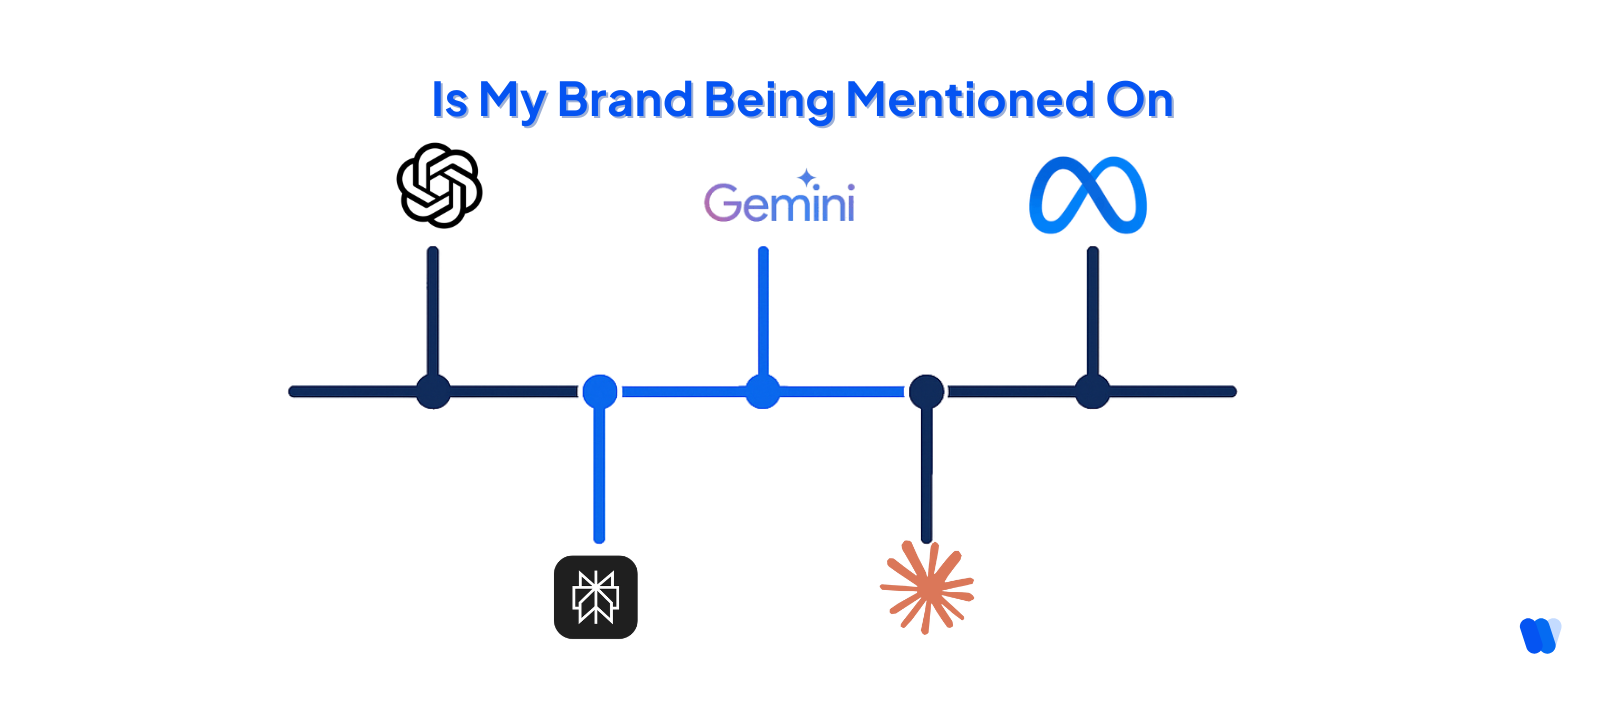
Marketers love dashboards. We track impressions, clicks, backlinks, and keyword rankings, but none of those tell us if we’re visible inside AI-generated answers from ChatGPT, Claude, Gemini, or Perplexity.
That’s where GEO KPIs (Generative Engine Optimization Key Performance Indicators) come in. These metrics don’t measure rankings; they measure AI visibility: how often, how accurately, and how favorably your brand appears in generative search results.
In 2025, the question isn’t “Are we ranking?” It’s “Are we being cited?”
Tracking GEO KPIs such as citation count, brand mentions, AI visibility rate, and source URLs lets you understand your true presence in the AI search ecosystem — something Google Analytics 4 or Search Console can’t show.
According to Wellows’ 2025 GEO Visibility Research, over 73% of brands tracked have zero mentions in AI-generated responses, even when ranking on page one in Google. That means most marketers are reporting success in a shrinking channel and missing where discovery now happens: inside LLMs.
This guide breaks down what GEO KPIs are, how they differ from traditional SEO metrics, and which ones you should track to measure, benchmark, and grow your brand’s visibility in AI-powered search.
TLDR:
GEO KPIs are the new success metrics for AI-powered search—they measure how visible and credible your brand is inside AI answers, not just Google.
What to track (2025):
- Citation Count – how often AIs reference you
- Brand Mentions – appearances in ChatGPT/Claude/Perplexity/Gemini
- Source URLs – links back to your site
- AI Visibility Rate (AIGVR) – % of queries where you appear
- Share of Voice (SoV) – your citations vs. competitors
- AI Referral Conversion Rate – conversions from AI-sourced visitors
GEO vs SEO:
SEO = clicks & rankings. GEO = mentions, citations, influence (zero-click visibility).
Benchmarks (guide):
B2B SaaS 10–15 / mo • E-commerce 15–25 • Financial 12–18
Prioritize Citation Score quality (frequency, context, platform diversity) over raw volume.
Tracking:
- GA4 captures AI referral clicks (not non-click citations).
- Wellows automates Citation Score, AIGVR, and SoV across major LLMs.
Why it matters: As AI search usage surges, GEO KPIs show whether your brand exists where decisions now happen.
What Are the Primary KPIs for Measuring GEO Success?
Generative engine optimization isn’t about manipulating algorithms—it’s about ensuring your brand is present and recognized in AI-generated responses. Unlike traditional SEO, where visibility is tied to search engine rankings and click-throughs, GEO success is measured by how AI Algorithm updates influence relevance, authority, and source selection within the answers provided by tools like ChatGPT, Gemini, or Perplexity.
So how do you measure that kind of visibility? You need to look at KPIs on two levels:
- AI-Native KPIs — indicators like tracked searches, brand mentions, link presence, positioning, and sentiment. These reflect how generative engines actually reference and position your brand inside answers.
- Business Impact KPIs — metrics such as citation quality, AI-driven referral traffic, conversion rates, and authority signals. These reveal the tangible results of GEO on traffic, leads, and brand trust.
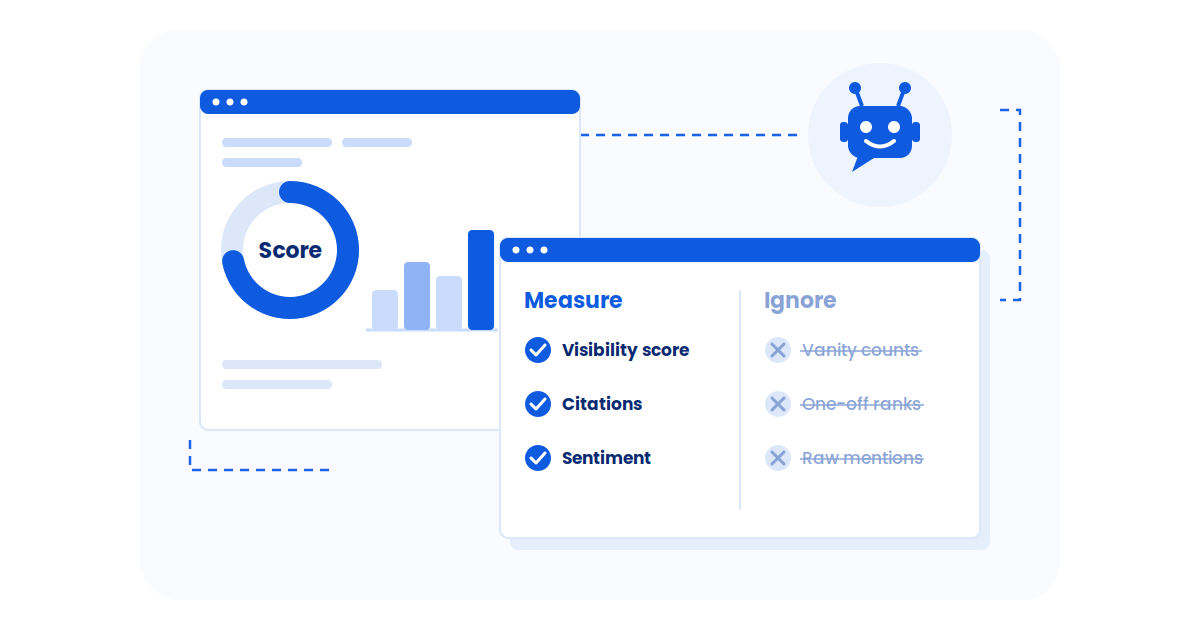
Together, these layers ensure you’re not only visible inside AI-generated responses but also turning that visibility into measurable outcomes. These aren’t vanity metrics—they’re signs that generative engines understand your relevance and authority within a specific topic space.
Capturing this visibility requires the groundwork to combine SEO and GEO, so your content is structured and positioned to appear where it matters most.
Here are the 6 GEO AI-Native KPIs that matter most:
1Tracked Searches
2Brand Mentions in Responses
3Competitor Mentions
4Link Presence5
Position of Mentions and Links
6Sentiment of Brand Mentions
Tracked Searches
What it is:
These are the specific, intent-driven queries your target audience inputs into AI platforms like ChatGPT, Gemini, or Perplexity —i.e., how AI Agents as Web Users discover brands.” Unlike traditional SEO keywords, these are often full questions or phrases reflecting real user intent.
⚠️ Why This Matters
Identifying and monitoring these queries ensures your content aligns with the actual needs and language of your audience. It’s about understanding the questions your potential customers are asking and ensuring your brand provides the answers.
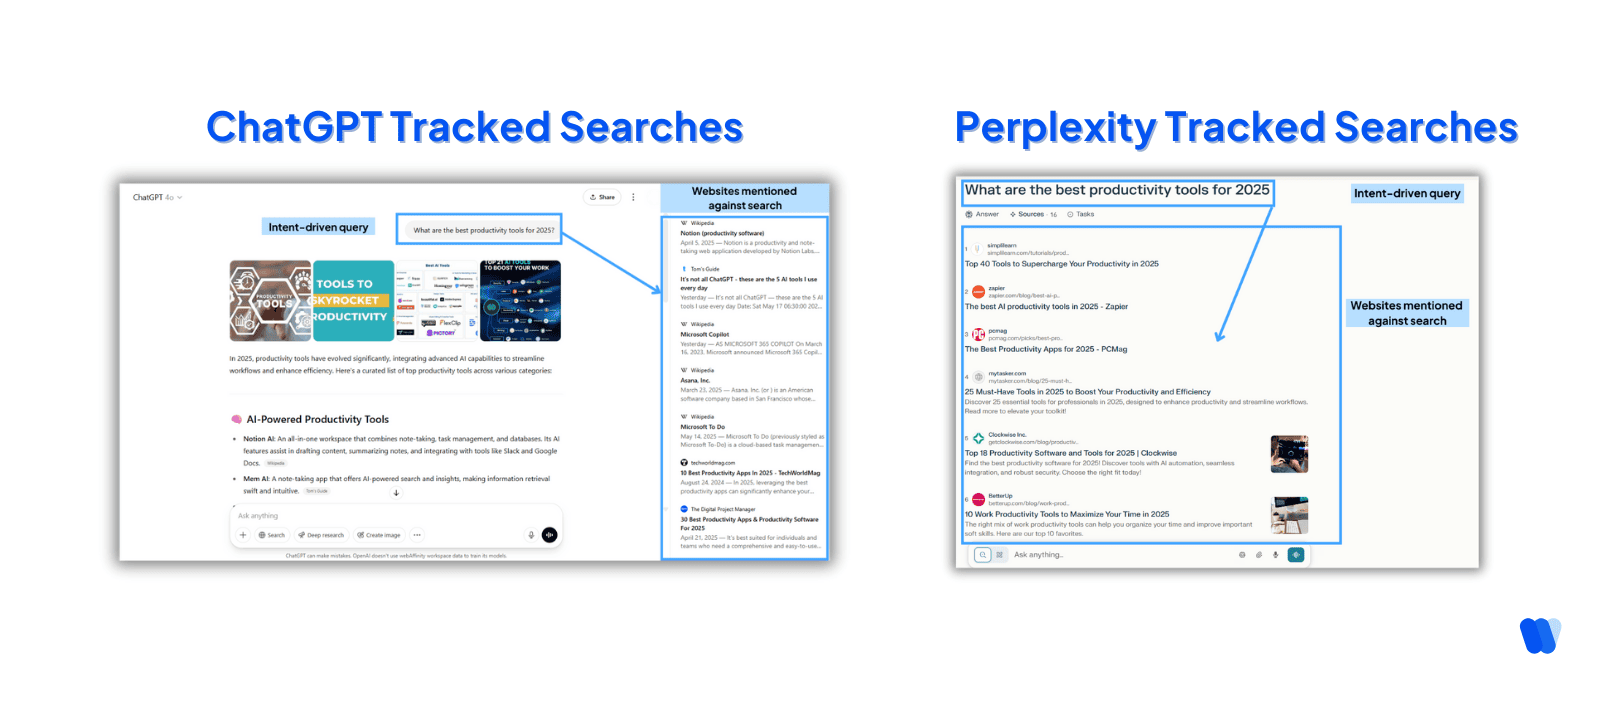
If you ask an LLM, “What are the best productivity tools for 2025?”, and your brand isn’t part of the response, that’s your signal. Tracked searches are those real, intent-filled queries people are typing into AI tool. They are not just keywords, but full questions. If you’re wondering how to make sure your content shows up, here’s how to boost your visibility on ChatGPT.
You want to be present when someone types “AI tools for productivity 2025” or “best task managers for teams this year.”
Start compiling these kinds of questions. Plug them into the major AI tools regularly. If your name shows up, you’re on the right track. If not, your content might not be aligning with the language your audience actually uses.
✅How to track it:
-
- Compile a list of relevant questions and phrases your audience might use.
- Regularly input these into AI platforms to see if and how your brand appears.
- Adjust your content strategy based on these insights to improve the content readability score.
Brand Mentions in Responses
What it is:
This KPI measures how often and in what context your brand is mentioned in AI-generated responses to relevant queries.
⚠️ Why This Matters
Frequent and positive mentions indicate that AI models recognize your brand as a credible source, increasing the likelihood of being recommended to users.
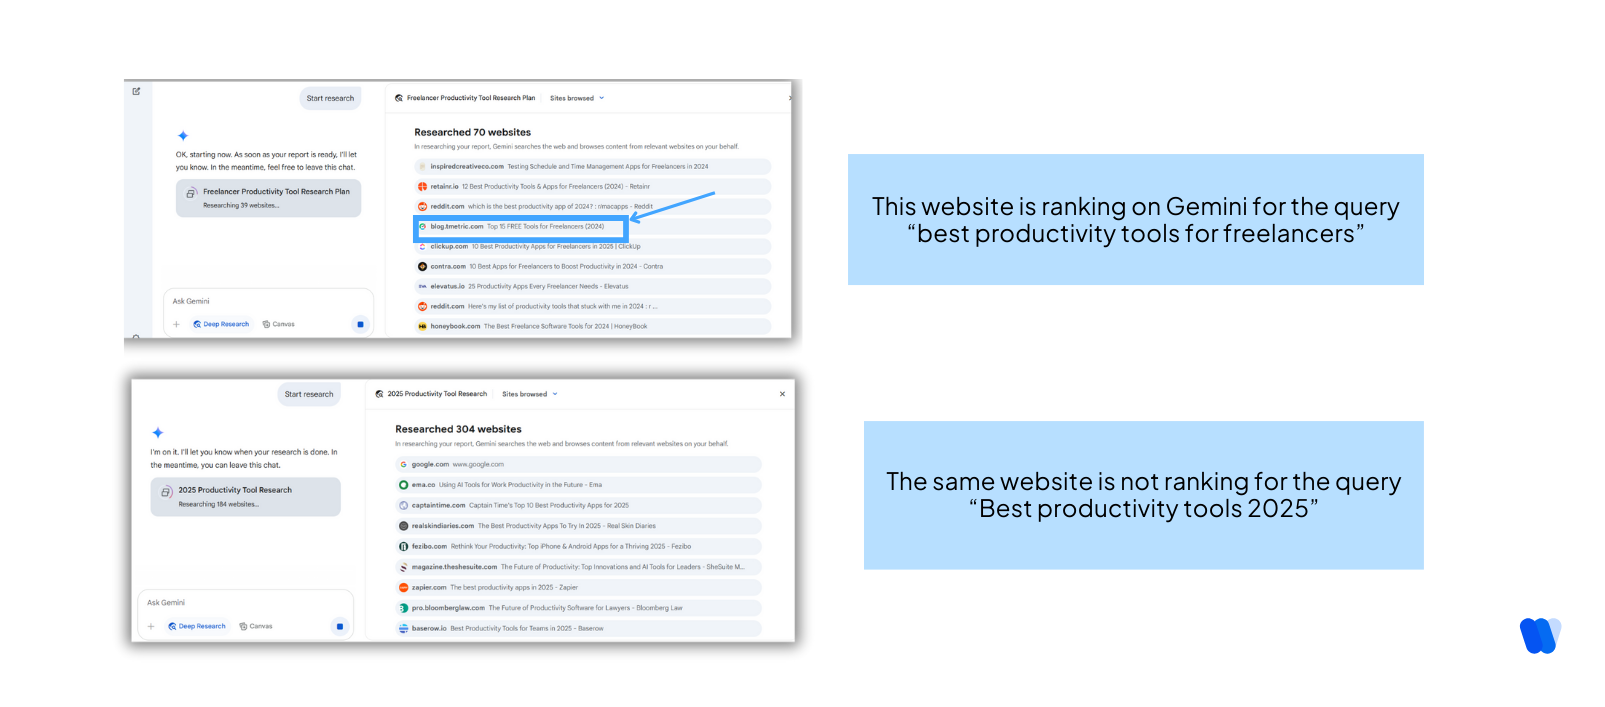
If you type into ChatGPT or Gemini, “best productivity tools 2025,” and your brand isn’t there, it means there is a visibility gap you can’t ignore. But here’s the thing: you might still be showing up for other queries.
Maybe your tool is ranking for more specific or niche prompts like “best productivity app for freelancers,” or “tools with built-in AI scheduling features,” or even something as unique as “calm productivity tools for ADHD workflows.”
That’s still a win, and it shows how AI currently understands your positioning. The goal is to map all the kinds of queries where your brand does show up, then expand from there. Using the Top GEO Tactics, you can turn those mentions into stronger positioning and higher trust in AI answers.
✅How to track it:
-
- Use AI platforms to search for your brand in response to relevant queries.
- Note the frequency and context of mentions.
- Tools like Brand24 or Mention can help automate this monitoring process.
Competitor Mentions
What it is:
This involves analyzing which competitors are mentioned in AI responses alongside or instead of your brand.
⚠️ Why This Matters
Understanding your competitors’ presence helps identify gaps in your content strategy and areas where they may be outperforming you in AI visibility.
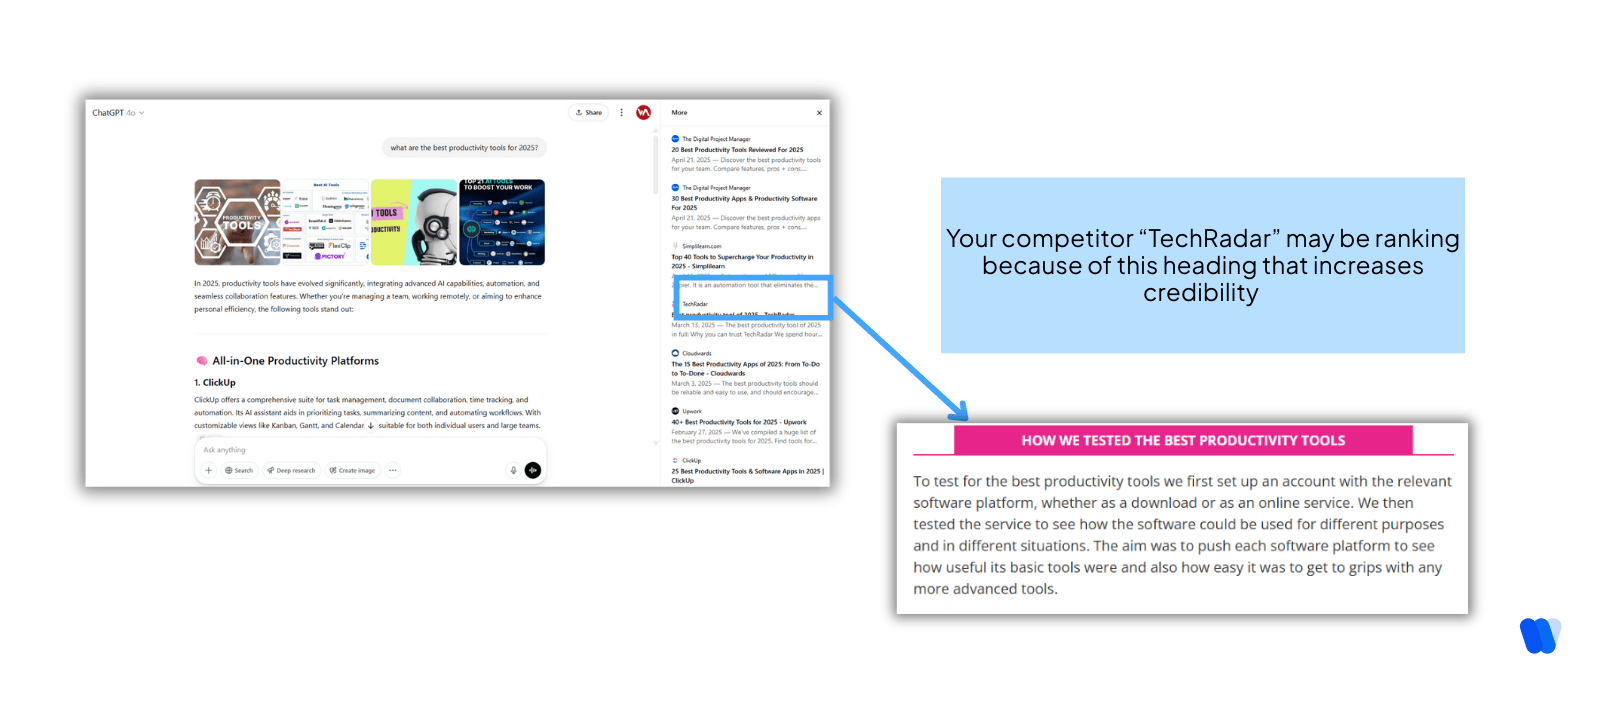
If AI keeps bringing up your competitors’ blogs but doesn’t mention you, that’s a red flag. It means your competitors are doing something right in the eyes of these models, whether it’s better content, more backlinks, or just being talked about more.
You need to monitor the same responses you’re targeting and see who’s showing up instead of you. Then dig into their content. Are they writing better guides? Using clearer metadata? Getting quoted more often?
This is often where teams turn to a Generative Engine Optimization Checklist for Brand Visibility to pinpoint the structural or contextual gaps competitors are outperforming them on, a workflow commonly handled by generative engine optimization agencies.
It’s about understanding why AI favors them—and finding ways to shift that balance in your favor, an ongoing challenge for any AI search visibility platform for agencies working to sustain visibility across competitive client segments.
If you want to learn more about why certain websites rank on LLMs read more here: What are Generative Engine Ranking Factors?
✅How to track it:
-
- Monitor AI responses to relevant queries for competitor mentions.
- Compare the frequency and context of their mentions to yours.
- Analyze their content to understand why AI models might favor them.
Link Presence
What it is:
This KPI assesses whether AI-generated responses include hyperlinks and if those links direct users to your content.
⚠️ Why This Matters
Links in AI responses can drive direct traffic to your site and signal to AI models that your content is authoritative and trustworthy.
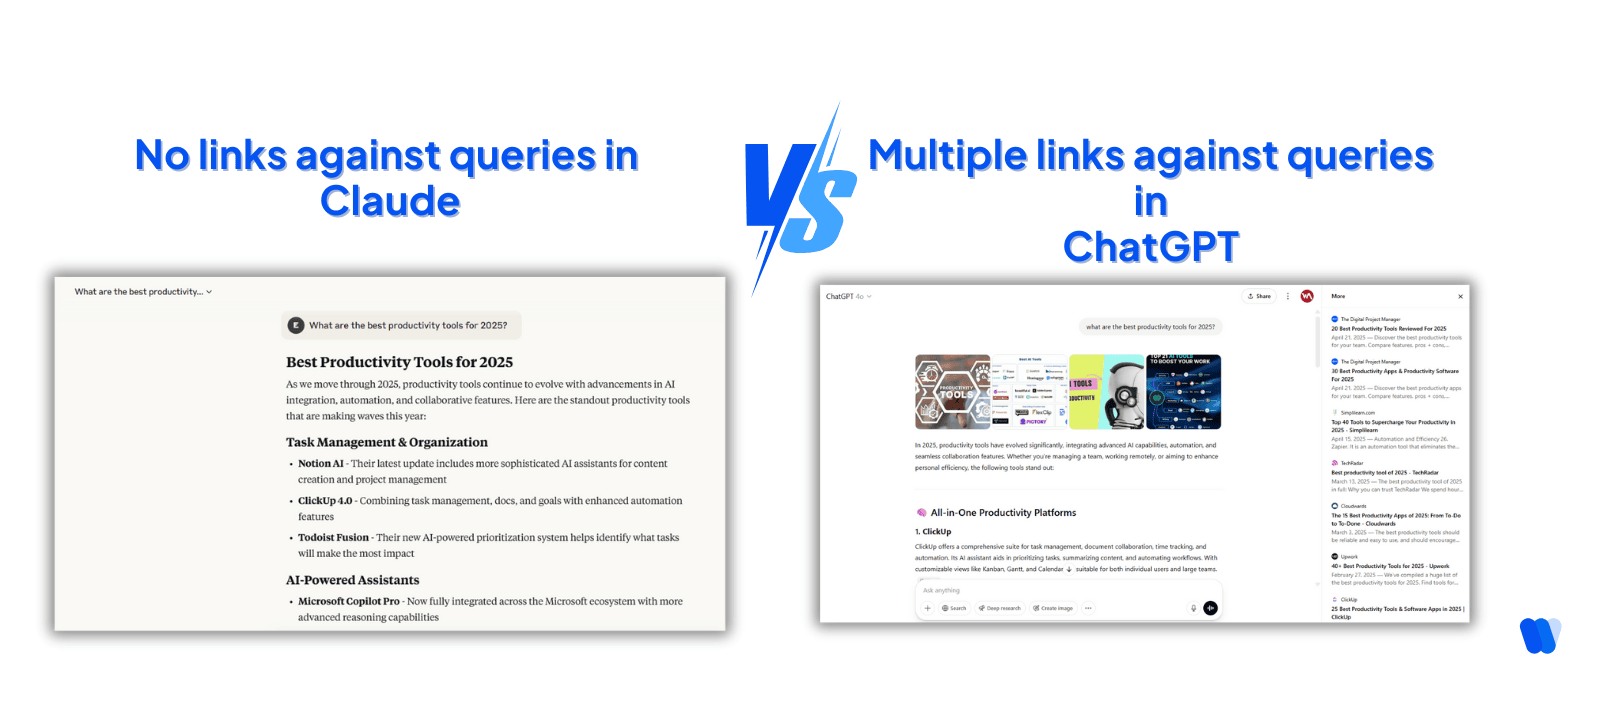
If you ask Perplexity “What are the best productivity tools in 2025?” and it gives you a list with links, those links are gold. That’s literal traffic being handed over by the AI. You want to be one of those links.
So check: do the answers link out at all? And if they do, are they linking to your website or someone else’s blog? If your competitors are getting those links, use tools like Ahrefs or SEMrush to track where they’re coming from and what content is earning that attention.
Their content may be stronger in key Search Engine Ranking Factors like trustworthiness, domain strength, and topical coverage—signals still valued by LLMs when choosing citation-worthy sources.
✅How to track it:
-
- Examine AI responses for the presence of hyperlinks.
- Determine if the links point to your content or competitors’.
- Use tools like Ahrefs or SEMrush to monitor backlinks and referral traffic.
Position of Mentions and Links
What it is:
This measures where your brand or content appears within AI-generated responses—beginning, middle, or end.
⚠️ Why This Matters
Placement affects visibility and user engagement. Being mentioned early in a response increases the likelihood of user interaction.
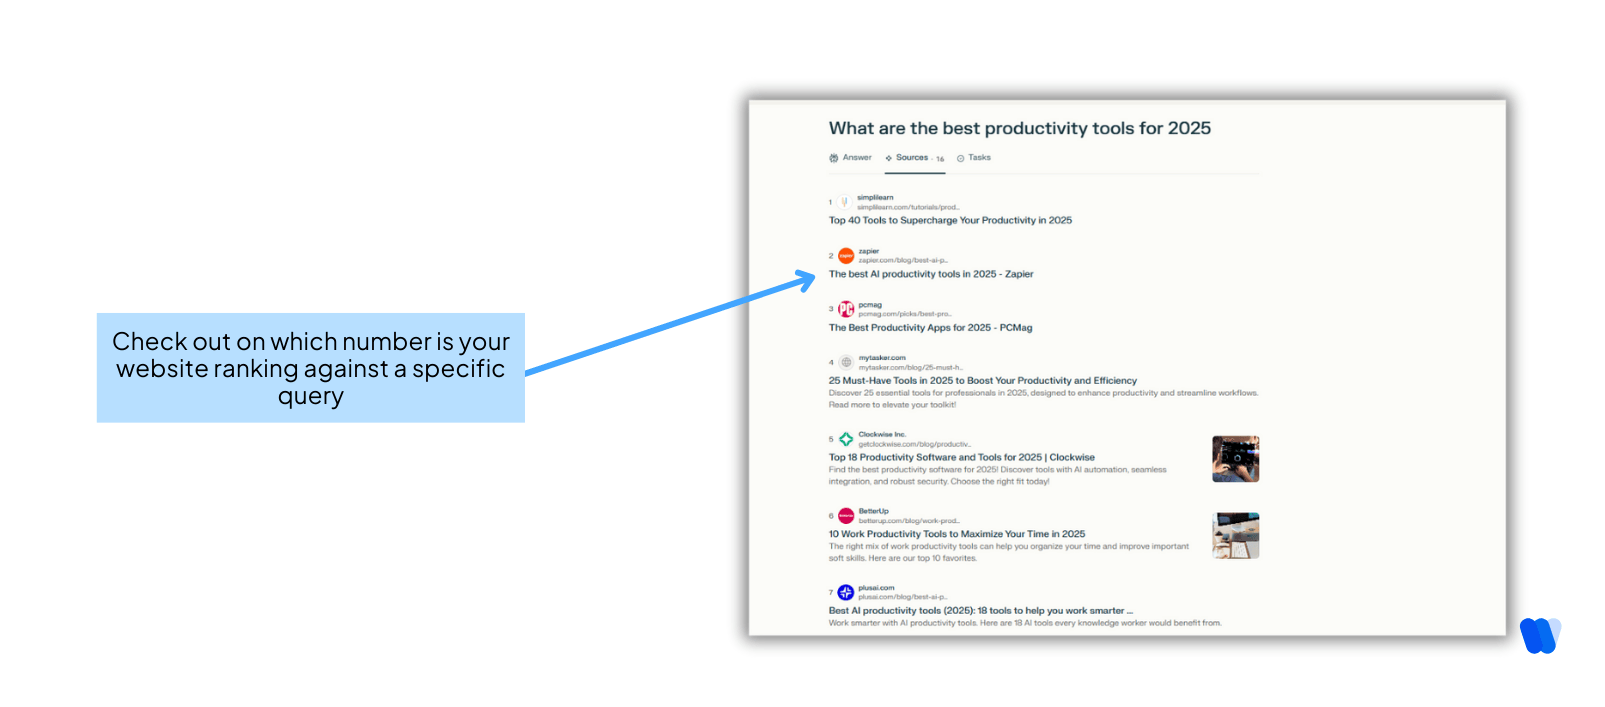
It’s not just whether you’re mentioned, it’s where. If Perplexity opens with “Notion is one of the best productivity tools in 2025,” and you’re listed fifth or in a footnote, the impression you leave is totally different. You want top billing. You want to be the first thing the model says when someone asks that question.
So track where your name shows up in AI responses, beginning, middle, or end. Compare that with how your competitors are being positioned. Often, placement is a reflection of perceived authority. You can shift that by strengthening your topical relevance through better structured content, fresher examples, and clearer signals of expertise.
✅How to track it:
-
- Analyze AI responses to see where your brand is mentioned.
- Compare the positioning to competitors.
- Adjust your content to aim for more prominent placement.
Sentiment of Brand Mentions
What it is:
This evaluates the tone and context of how your brand is mentioned—positive, neutral, or negative.
⚠️ Why This Matters
Positive sentiment enhances brand reputation and trust, while negative sentiment can deter potential customers.
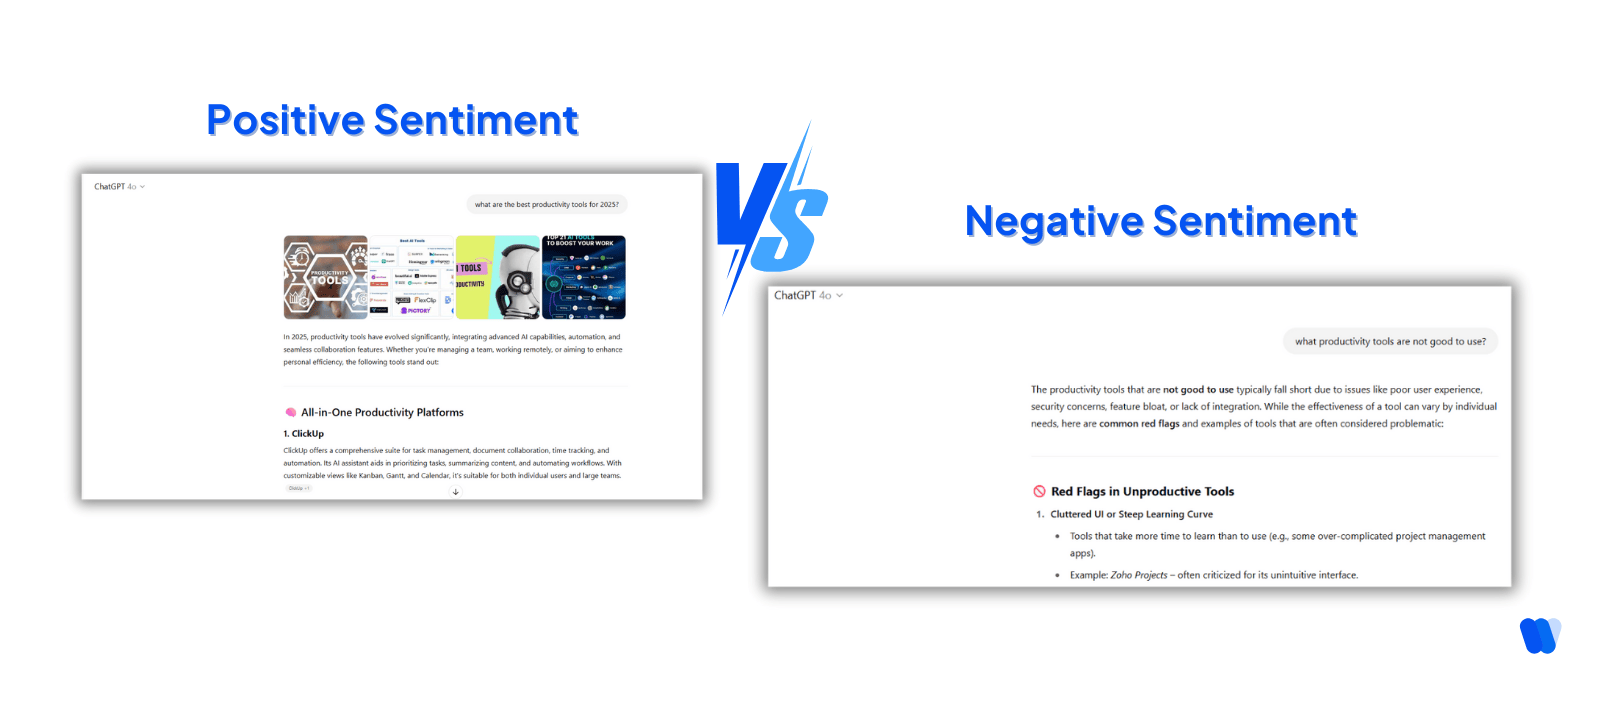
Let’s say your brand shows up in a blog that ranks for “best productivity tools 2025.” That’s a solid win, and even better if the tone is positive, like: “Tool X stands out for its minimalist UI and AI-powered workflows that actually save time.” Now flip that. What if another blog ranks for a query like “productivity tools to avoid in 2025,” and your brand is listed as clunky or overpriced? That’s a huge problem.
It’s not just about being mentioned, it’s about what kind of query you’re being associated with. Positive queries like “top tools,” “best AI productivity apps,” or “must-have tools for 2025” signal endorsement and trust.
Negative queries like “worst tools,” “overrated productivity apps,” or “tools to avoid this year” damage your reputation before a user even clicks. If your brand is getting dragged in the blogs ranking for those kinds of negative terms, you need to act.
✅How to track it:
-
- Use sentiment analysis tools to assess the tone of AI-generated mentions.
- Monitor changes over time to identify trends.
- Address negative sentiment by improving content quality and addressing customer concerns.
Core Business KPIs for Measuring GEO Success
Generative Engine Optimization (GEO) is centered on strengthening a brand’s visibility and authority in AI-generated answers. To evaluate how effective your GEO efforts are, you need to track Key Performance Indicators (KPIs) that reveal both your presence and your influence across AI-driven platforms.
This KPI evaluates how often and in what context your brand is cited by AI systems. Regular monitoring of citation activity shows how established your brand is becoming within generative outputs. This KPI measures how much traffic AI platforms send to your website and how engaged those visitors are. This KPI helps you understand not just how much traffic AI platforms send, but also how engaged that audience is once they arrive. This KPI tracks how often your brand appears in AI-generated summaries and how it compares to competitors. These measures indicate your overall visibility and competitiveness within AI-curated content. This KPI focuses on turning AI-driven visibility into tangible actions and revenue impact. This directly connects visibility in AI answers to measurable business growth. This KPI reflects your brand’s credibility based on domain authority and external backlink signals. A strong authority and backlink profile increases the likelihood of being cited by AI engines as a trusted resource.1. Citation Frequency and Quality
2. Referral Traffic from AI Platforms
3. Brand Presence in AI Overviews
4. Conversions from AI-Referred Traffic
5. Content Authority and Backlink Strength
What KPIs Should I Track for GEO: Citation Count, Brand Mentions, or Source URLs?
Track all three: citation count, brand mentions, and source URLs, because each reveals different dimensions of your AI search visibility performance.
Citation count measures authority recognition, brand mentions indicate awareness reach, and source URLs show content attribution accuracy.
According to First Page Sage’s 18-month analysis of 127 companies, brands tracking this complete KPI stack achieved 27% higher conversion rates and 9.2% higher lead quality scores compared to those monitoring traffic metrics alone.
The Essential GEO KPI Framework
1. Citation Count: Authority Signal
Definition: The total number of times AI models reference your brand or content with proper attribution across tracked queries.
Why it matters: Wellows analysis of Reddit discussions found that 73% of GEO practitioners identify citation tracking as their primary success metric, with one practitioner noting: “Most tools are still half-baked because there’s no search console for ChatGPT.”
Industry benchmarks from First Page Sage research:
- B2B SaaS: 10-15 citations/month with 8.3/10 lead quality score
- Healthcare: 8-12 citations/month with 8.7/10 lead quality score
- Financial Services: 12-18 citations/month with 8.9/10 lead quality score
- E-commerce: 15-25 citations/month with 7.6/10 lead quality score
2. Brand Mentions: Awareness Indicator
Definition: Frequency of your brand appearing in AI responses, even without direct citations or links.
Wellows research insight: Our analysis of r/GenEngineOptimization discussions revealed practitioners classify mentions into three strategic categories:
| Mention Type | % of AI Search Volume | Strategic Value |
|---|---|---|
| Branded queries (“What is [Brand]?”) | 37% | Direct awareness measurement |
| Competitive queries (“[Competitor] vs [Brand]”) | 41% | Market positioning insight |
| Informational queries (“Best tools for…”) | 22% | Discovery opportunity |
As one Reddit practitioner explained: “Category-level prompts tell you so much more about share of voice over branded ones. That’s how buyers base purchase decisions anyway.”
3. Source URLs: Attribution Accuracy
Definition: Tracking which specific pages AI models cite as sources when mentioning your brand.
Critical insight from Wellows community analysis: One practitioner using Waikay reported: “What I like is that it doesn’t just say ‘yes/no’ on mentions, it shows frequency, the context you appear in (product recs, comparisons, Q&A), and even where the model’s description doesn’t match reality. That last one has been gold for catching and fixing misconceptions before they spread.”
Beyond the Big Three: Complementary GEO KPIs
Share of Voice (SoV)
According to Marketing LTB’s compilation of 98+ GEO statistics, top brands dominate AI citations—the top 50 brands account for a disproportionate share of all AI Overview sources, while 26% of brands have zero mentions in tracked queries.
Wellows autonomous marketing platform enables continuous share of voice monitoring across ChatGPT, Claude, Perplexity, and Gemini, comparing your brand’s citation frequency against competitors in real-time.
Sentiment Analysis
The AI visibility challenge: Being mentioned isn’t enough if the context is negative. AI visibility tool founders caution that “LLMs rarely ‘speak badly’ about brands unless explicitly prompted to,” making negative sentiment particularly damaging when it occurs.
AI Referral Traffic
The “Dark Chat” phenomenon: Wellows discovered through Reddit analysis that one agency’s web analytics showed 0% leads from ChatGPT, but customer surveys revealed 21% actually discovered them via ChatGPT and 2% via Perplexity, a 21% attribution discrepancy similar to the historical “Dark Social” problem.
What GEO Benchmarks Should I Use: 10 Citations Per Month, 50, or 100?
Realistic GEO benchmarks vary dramatically by industry, with B2B SaaS averaging 10-15 citations/month and e-commerce reaching 15-25 citations/month, according to First Page Sage’s analysis of 127 companies.
The research reveals that citation volume alone is a misleading metric, lead quality scores and conversion timelines matter more, with healthcare achieving 8.7/10 lead quality despite only 8-12 monthly citations.
Industry-Specific Citation Benchmarks (2025 Data)
High-Volume Industries
| Industry | Monthly Citation Target | Lead Quality Score | Time to Convert | Key Success Factor |
|---|---|---|---|---|
| E-commerce | 15-25 | 7.6/10 | 11 days | Product detail richness |
| Hospitality | 12-20 | 7.4/10 | 16 days | Review aggregation |
| IT/Managed Services | 12-18 | 8.1/10 | 38 days | Technical authority |
Quality-Over-Volume Industries
| Industry | Monthly Citation Target | Lead Quality Score | Time to Convert | Key Success Factor |
|---|---|---|---|---|
| Healthcare | 8-12 | 8.7/10 | 53 days | Medical credibility |
| Financial Services | 12-18 | 8.9/10 | 44 days | Regulatory compliance |
| Legal Services | 10-16 | 8.6/10 | 39 days | Case study depth |
| Higher Education | 8-14 | 8.5/10 | 61 days | Institutional reputation |
Data source: First Page Sage 18-month GEO CAC study
Why Raw Citation Numbers Mislead
Wellows analysis of benchmark data reveals three critical factors that matter more than volume:
1. Citation Context Quality
Reddit practitioners emphasize that appearing in 50 responses as a “passing mention” provides far less value than 10 citations where your brand is the primary recommendation.
“It doesn’t just say ‘yes/no’ on mentions, it shows frequency, the context you appear in (product recs, comparisons, Q&A).”
2. Conversion Efficiency
First Page Sage data shows B2B SaaS converts in 45 days with only 10-15 citations/month, while e-commerce requires 15-25 citations but converts in just 11 days. The business model dictates optimal volume.
3. Query Universe Size
Wellows methodology consideration: A brand tracking 100 queries will naturally achieve higher absolute citation counts than one tracking 30 queries. Citation rate percentage (citations ÷ tracked queries) provides better comparability than raw numbers.
Company Size Benchmark Variations
According to First Page Sage research, smaller companies achieve more efficient citation rates:
| Company Size | Average GEO CAC | Lead Conversion Rate | Expected Monthly Citations |
|---|---|---|---|
| Startup (<$1M ARR) | $492 | 31% | 8-15 (highly efficient) |
| Small Business ($1M-$10M) | $461 | 28% | 10-20 |
| Mid-Market ($10M-$100M) | $602 | 26% | 15-30 |
| Enterprise (>$100M) | $716 | 24% | 25-50 |
Setting Your Benchmark: The Wellows Framework
Step 1: Calculate Your Citation Rate Baseline
Formula: (Current monthly citations ÷ Total tracked queries) × 100
Example: If you’re tracking 100 queries and appear in 12 responses, your baseline citation rate is 12%.
Step 2: Set Realistic Growth Targets
| Starting Point | 3-Month Target | 6-Month Target | 12-Month Target |
|---|---|---|---|
| 0-5% citation rate | 8-12% | 12-18% | 18-25% |
| 5-10% citation rate | 12-15% | 15-22% | 22-30% |
| 10-15% citation rate | 15-20% | 20-28% | 28-35% |
Step 3: Benchmark Against Competitors
Wellows competitive insights feature compares your citation performance to rivals across topics, providing strategic guidance on where to focus optimization efforts.
McKinsey research confirms that even market leaders experience 20-50% lower GEO performance compared to their SEO rankings, making competitive benchmarking essential.
Beyond Volume: The Citation Score Approach
Rather than fixating on arbitrary numbers like 10, 50, or 100 citations per month, Wellows recommends tracking Citation Score, an aggregated metric that considers:
- Citation frequency: How often you’re mentioned
- Citation prominence: Primary recommendation vs. secondary mention
- Platform diversity: Appearing across ChatGPT, Claude, Perplexity, Gemini
- Context quality: Positive recommendation vs. neutral mention vs. comparison
- Competitive positioning: Your share of voice vs. rivals
This holistic approach, available through the Wellows platform, provides a more actionable benchmark than raw citation counts alone.
Academic Validation: What Research Says About Benchmarks
University of Waterloo research on Generative Engine Optimization confirms that “citation-rich responses” correlate with content that includes “quotations, statistics, and structured data”—suggesting that quality factors driving citations matter more than achieving arbitrary volume targets.
The research validates: Focus on citation-worthy content characteristics (authority, structure, unique data) rather than chasing volume benchmarks without a strategic foundation.
Why are GEO KPIs Essential for Your Brand?
According to Gartner’s February 2024 research focused on the U.S. market, traditional search volume is expected to decrease by 25% by 2026.
As AI tools like Google Search Generative Experience (SGE), ChatGPT, and Perplexity become default discovery platforms, traditional SEO metrics just don’t cut it anymore. GEO KPIs give you a clearer picture of how AI understands, ranks, and presents your brand. Here’s why they’re essential:
Top 5 Reasons why GEO KPIs are Essential
You’re no longer competing for blue links—you’re competing for answers.
If AI gives instant responses, users may never scroll. GEO KPIs tell you if your brand is actually inside that answer.
You can’t improve what you don’t track.
Without measuring brand mentions, sentiment, or link presence in AI-generated content, you’ll have no idea if your content is resonating, or disappearing.
Traditional SEO stops at impressions. GEO looks at influence.
GEO KPIs measure how trusted, visible, and relevant your brand is within AI summaries, not just how many people saw your meta description.
AI responses are curated. GEO tells you if you’re part of the curation.
Whether it’s Google SGE pulling from blog content or ChatGPT naming top tools, GEO helps you understand if your brand is considered worth mentioning.
Your competitors are already there.
If you’re not tracking GEO, you’re missing how often tools like Notion, ClickUp, or Sunsama are dominating the answers.
Can Someone Explain What GEO KPIs Are and Why They Matter for Digital Marketing?
Generative Engine Optimization (GEO) KPIs are performance metrics specifically designed to measure your brand’s visibility, citation frequency, sentiment, and influence within AI-generated responses across platforms like ChatGPT, Claude, Perplexity, and Google AI Overviews, fundamentally different from traditional SEO metrics that track search engine rankings and website traffic.
These KPIs matter because McKinsey research reveals that 44% of consumers now cite AI-powered search as their primary information source, making GEO measurement essential for brands to understand where they stand in the AI discovery landscape.
The Fundamental Shift: Why SEO Metrics Don’t Work for AI Search
Traditional SEO: Link-Focused Discovery
When someone searches “best project management software” on Google:
- They see a list of 10 blue links
- They click on 2-3 results to research
- Each click generates measurable traffic in your analytics
- You optimize for position #1 to maximize clicks
SEO KPIs measure this journey: Impressions, clicks, CTR, rankings, bounce rate, pages/session
GEO: Answer-Focused Discovery
When someone asks ChatGPT “best project management software”:
- AI generates a comprehensive answer listing 3-5 tools
- User reads the comparison directly in ChatGPT
- They may or may not click through to websites
- Decision is often made within the AI conversation
GEO KPIs measure this journey: Brand mentions, citation frequency, positioning, sentiment, share of voice
Why This Matters: The 25% Traffic Decline
Gartner predicts traditional search volume will decline 25% by 2026 as AI chatbots reshape discovery. Meanwhile, zero-click search rates have reached 40-60% for many query types—meaning users get answers without visiting websites.
The visibility crisis: If you’re only tracking Google Analytics traffic and Search Console impressions, you’re missing:
- Users who discover your brand through AI but never click
- Competitive positioning in AI-generated recommendations
- Whether AI accurately represents your product/service
- Market share in the AI discovery landscape
As one Reddit practitioner described the challenge:
“My team is seeing more referrals from chatgpt and we don’t really know what queries people entered to find us.”
The Core GEO KPIs Explained
1. Brand Mention Frequency
What it is: How often AI platforms mention your brand across relevant category queries.
Why it matters: Mentions = awareness. If ChatGPT never mentions your brand when users ask about your category, you’re invisible in the AI discovery channel.
How to measure: Test 50-100 queries like “best [category] for [use case]” and count how many responses include your brand.
Real-world benchmark: First Page Sage research shows B2B SaaS brands averaging 10-15 mentions per month achieve 8.3/10 lead quality scores.
2. Citation Rate
What it is: The percentage of mentions that include attribution links or source credits pointing to your content.
Why it matters: Citations build authority and can drive referral traffic. Industry data shows that brands appearing in AI Overviews (with citations) are often already in Google’s top 10, creating a reinforcing visibility cycle.
How to measure: Of the queries where your brand appears, what percentage includes clickable links to your website?
3. Share of Voice (SoV)
What it is: Your brand’s mention frequency relative to competitors in AI-generated responses.
Why it matters: Research reveals that top 50 brands dominate AI citations—if competitors consistently appear and you don’t, you’re losing market share in the AI discovery channel.
How to measure: Calculate: (Your mentions ÷ Total category mentions) × 100
Industry insight: McKinsey found that even market leaders experience 20-50% lower GEO performance compared to their SEO rankings, making SoV tracking essential.
4. Sentiment & Context
What it is: Whether AI mentions frame your brand positively (recommended), neutrally (listed), or negatively (cautioned against).
Why it matters: Being mentioned with negative context damages brand perception. As Reddit analysis revealed, practitioners using sentiment tracking “catch and fix misconceptions before they spread.”
5. AI Referral Conversion
What it is: The percentage of conversions attributed to users discovering your brand through AI platforms.
Why it matters: This is the ROI metric. As one practitioner stated: “The one metric that really matters IMO is conversions coming from LLMs.”
How to measure: Combine GA4 referral tracking with lead form surveys asking “How did you find us?”
The “Dark Chat” discovery: Wellows Reddit analysis found one agency whose analytics showed 0% AI traffic, but surveys revealed 21% of customers discovered them via ChatGPT—a massive attribution gap.
Why These KPIs Matter for Your Business
Reason #1: Consumer Behavior Has Permanently Shifted
- 50% of consumers intentionally seek out AI-powered search engines
- 44% cite it as their primary digital source for buying decisions
- Usage spans all age groups, including baby boomers
- $750 billion in US revenue will funnel through AI-powered search by 2028
Translation: If you’re not visible in AI search, you’re invisible to a massive and growing segment of your potential customers.
Reason #2: Traditional Metrics Create Blind Spots
Marketing LTB’s research reveals that only 16% of brands systematically track AI search performance, despite 56% using AI in SEO workflows—a massive execution gap.
The result? Brands invest in content that ranks on Google but never gets cited by AI, missing the visibility channel where decisions increasingly happen.
Reason #3: Competitive Positioning Is Being Established Now
Industry data shows that 26% of brands have zero mentions in AI Overviews. As AI platforms solidify their source preferences through algorithmic learning, early visibility winners will become increasingly entrenched.
The window is closing: Brands establishing GEO measurement and optimization now will capture disproportionate AI visibility as the channel matures.
Getting Started: Your First Week with GEO KPIs
Day 1: Establish Your Query Universe
List 30-50 queries your customers would ask about your category:
- “Best [product category] for [use case]”
- “[Your brand] vs [competitor]”
- “How to [solve problem your product addresses]”
- “[Product category] with [specific feature]”
Days 2-3: Manual Testing Baseline
Test your queries across ChatGPT, Claude, Perplexity, and Google AI Overviews:
- Track: Does your brand appear? (Yes/No)
- If yes: Primary mention or secondary? With citation link?
- Context: Recommended, neutral, or negative?
Days 4-5: Calculate Baseline KPIs
- Visibility Rate: (Mentions ÷ Total queries) × 100
- Citation Rate: (Mentions with links ÷ Total mentions) × 100
- Share of Voice: Track top 3 competitors and calculate relative frequency
Week 2 and Beyond: Establish Tracking
Manual tracking at scale becomes unsustainable—73% of Reddit practitioners cite this as their primary challenge.
The Wellows platform solution:
- Automates query testing across all major AI platforms
- Calculates Citation Score automatically (aggregated KPI)
- Provides weekly trending reports
- Benchmarks against competitors
- Alerts to significant changes
Bottom line: GEO KPIs aren’t optional add-ons to your existing SEO metrics, they’re essential measurements for a discovery channel that’s already reshaping how your customers find and evaluate brands. Ignoring them creates a massive competitive blind spot that early adopters are rapidly exploiting.
What Are the Most Important GEO KPIs for Measuring Success in AI-Powered Search Results?
The three most important GEO KPIs for measuring AI-powered search success are
- Citation Score, aggregating brand mentions across all AI platforms into a single KPI,
- AI Referral Conversion Rate, connecting visibility to revenue, and
- Share of Voice—benchmarking competitive positioning.
This prioritized framework, supported by McKinsey research showing 44% of users now primarily rely on AI-powered search for purchasing decisions, focuses on the metrics that directly impact business outcomes rather than vanity visibility numbers.
The Core Three: Priority KPI Framework
Priority #1: Citation Score (Composite Metric)
What it measures: An aggregated score combining your brand’s mention frequency, attribution quality, context positioning, and platform diversity across all major AI search engines.
Why it’s #1: Citation Score provides the single KPI you can track month-over-month, report to leadership, and optimize against—solving the “too many metrics” problem Reddit practitioners cite as a major challenge.
Wellows Citation Score methodology:
Citation Score = (Mention Frequency × 0.3) + (Attribution Quality × 0.25) + (Context Positioning × 0.25) + (Platform Diversity × 0.2)
Where:
- Mention Frequency: Total citations across all tracked queries (0-100)
- Attribution Quality: Percentage with source links and credits (0-100)
- Context Positioning: Primary vs. secondary mention weighting (0-100)
- Platform Diversity: Appearing across ChatGPT, Claude, Perplexity, Gemini (0-100)
Final Score Range: 0-100, with 60+ indicating strong AI visibility performance
Why this composite approach works: University of Waterloo research validates that multiple visibility dimensions (frequency, attribution, positioning) collectively determine AI search success more accurately than any single metric.
Tracking cadence: Calculate weekly, report monthly trends. The Wellows platform automates Citation Score calculation, providing real-time updates and historical trending.
Priority #2: AI Referral Conversion Rate
What it measures: The percentage of users who discover your brand through AI platforms and subsequently convert to customers.
Why it’s critical: Visibility without conversions is a vanity metric. First Page Sage’s 18-month study proves that GEO-attributed conversions achieve 27% higher rates and 9.2% better lead quality compared to traditional organic traffic.
Calculation methodology:
Step 1: GA4 Clickthrough Conversions
Track conversions from identified AI referral sources (chatgpt.com, perplexity.ai, claude.ai)
Step 2: Survey-Attributed Conversions
Add lead form question: “How did you first hear about us?” Calculate percentage selecting AI platform options.
Step 3: Combined Attribution
AI Referral Conversion Rate = (GA4 AI conversions + Survey AI conversions) ÷ Total conversions × 100
The “Dark Chat” adjustment: Based on Wellows Reddit analysis, add 15-20% to GA4-only numbers to account for users who discover via AI but convert through direct/organic channels.
Target benchmarks:
- Emerging AI visibility: 2-5% of total conversions attributed to AI discovery
- Developing AI presence: 5-12% AI-attributed conversions
- Strong AI visibility: 12-20% AI-attributed conversions
- AI-dominant brands: 20%+ AI-attributed conversions
Priority #3: Share of Voice (SoV) vs. Competitors
What it measures: Your brand’s citation frequency relative to competitors across category-defining queries.
Strategic importance: Industry research shows the top 50 brands capture a disproportionate share of AI citations—tracking SoV identifies whether you’re gaining or losing competitive positioning in this winner-take-most environment.
Measurement framework:
| Competitor Tier | Target SoV Range | Strategic Action |
|---|---|---|
| Category Leader | 30-45% SoV | Defend position, expand to adjacent categories |
| Major Competitor | 15-30% SoV | Attack leader’s weaknesses, strengthen differentiation |
| Challenger Brand | 5-15% SoV | Focus on sub-category dominance |
| Niche Player | 3-8% SoV | Hyper-specialize in specific use cases |
Wellows competitive insights: The platform automatically calculates SoV by testing queries across your competitive set, tracking weekly changes, and alerting you when competitors make significant gains that threaten your positioning.
Supporting KPIs: The Second Tier
While Citation Score, Conversion Rate, and Share of Voice form the core, these supporting metrics provide diagnostic depth:
4. Brand Mention Sentiment
Percentage of citations framing your brand positively vs. neutrally vs. negatively. Target: 80%+ positive/neutral sentiment.
5. Citation Consistency Rate
How often AI platforms cite you for the same query tested repeatedly over time. Target: 70%+ consistency (indicates stable algorithmic recognition).
6. Implicit Citation Gap
Domains mentioning competitors but not your brand, Wellows’ implicit citation tracking reveals outreach opportunities to close visibility gaps.
7. Average Citation Position
Your mean position when mentioned in AI-generated lists. Target: Position 1-3 for primary category queries.
8. Platform Coverage Diversity
Appearing across ChatGPT, Claude, Perplexity, and Gemini vs. concentrated in one platform. Target: 75%+ queries showing brand in 3+ platforms.
From KPIs to Action: The Wellows Implementation Approach
Phase 1: Baseline Measurement (Weeks 1-4)
- Establish current Citation Score across 50-100 tracked queries
- Calculate baseline AI Referral Conversion Rate (GA4 + surveys)
- Benchmark Share of Voice against top 3-5 competitors
Phase 2: Strategic Optimization (Months 2-3)
- Identify implicit citation gaps—domains citing competitors but not your brand
- Optimize content for citation-worthy characteristics (statistics, structured data, quotes)
- Improve positioning on queries where you’re mentioned 4th-5th
Phase 3: Scale & Sustain (Months 4-6)
- Expand query universe to cover more category and sub-category terms
- Implement continuous monitoring via Wellows platform
- Establish executive reporting cadence on Citation Score trends
The Wellows autonomous marketing platform automates all three phases, providing the GEO measurement infrastructure that 73% of practitioners currently lack.
How Do GEO KPIs Differ from Traditional SEO Metrics?
GEO KPIs measure brand visibility and influence within AI-generated content (citation frequency, mention context, share of voice), while SEO metrics track website discoverability in search engine results pages (rankings, impressions, clicks, CTR), fundamentally different because AI search often provides answers without users clicking through to websites.
This distinction matters because AI Overviews reduce clicks to websites by 30%+ even when content is cited, making traditional traffic-focused metrics incomplete for measuring AI search success.
Side-by-Side Comparison: SEO vs. GEO KPIs
| Dimension | Traditional SEO Metrics | GEO KPIs |
|---|---|---|
| Primary Goal | Drive clicks from search results to your website | Achieve citations and mentions in AI-generated answers (with or without clicks) |
| Core Measurement Focus | Rankings, impressions, click-through rate, organic traffic volume | Brand mentions, citation frequency, share of voice, sentiment, attribution quality |
| Success Indicator | Ranking #1-3 for target keywords | Being mentioned as a primary recommendation in AI responses |
| User Behavior Assumed | Users click links to visit websites for information | Users who consume information within AI platforms may not click |
| Visibility Metric | Search impressions (how often your link appeared) | Citation inclusion rate (how often AI references your brand) |
| Competitive Positioning | SERP position (1-10) for specific keywords | Share of voice (your citations ÷ total category citations) |
| Content Optimization For | Search engine algorithms: keywords, backlinks, technical SEO, page speed | AI model preferences: structured data, citations, statistics, clear answers |
| Traffic Attribution | Direct: GA4 tracks Google referrals precisely | Indirect: Users see brand in AI, but visit via direct/organic later (“Dark Chat”) |
| Measurement Tools | Google Search Console, Google Analytics, keyword rank trackers | AI visibility platforms (Wellows, Profound, Peec), survey data, and manual testing |
| Zero-Click Impact | Lost opportunity (featured snippets reduce clicks) | Success metric (brand awareness without click requirement) |
| Time Horizon | SEO results are visible in 3-6 months | GEO impact measurable in weeks (AI models update frequently) |
| Brand vs. Traffic Focus | Traffic-first (maximize visitors to website) | Brand-first (maximize awareness and influence) |
The Fundamental Paradigm Difference
SEO: Impression → Click → Engagement Model
The traditional funnel:
- Impression: User searches, sees your link in results
- Click: User clicks through to your website
- Engagement: User spends time on site, views pages
- Conversion: User completes desired action
KPIs track each stage: Impressions measure opportunity, CTR measures appeal, bounce rate measures relevance, and conversions measure success.
GEO: Query → Citation → Influence Model
The AI-native funnel:
- Query: User asks AI platform a question
- Citation: AI mentions your brand in the generated response
- Influence: User considers your brand based on AI’s framing
- Decision: User may or may not visit your site (decision often happens within AI conversation)
KPIs track brand impact: Mention frequency measures visibility, share of voice measures competitive strength, sentiment measures perception quality.
Real-World Impact: Why the Difference Matters
Case Study Insight from Reddit Community
Wellows analysis of practitioner experiences reveals a common scenario:
SEO Dashboard says: “Traffic down 15% this quarter”
GA4 shows: Decreased organic traffic from Google
GEO Discovery reveals: Brand mentioned in 23% more AI responses, but users research in ChatGPT then visit directly
Reality: Visibility increased, but attribution shifted from “organic search” to “direct” traffic
Without GEO KPIs, this brand would think they’re losing visibility when they’re actually gaining AI search market share.
The Zero-Click Revolution
Industry research documents that zero-click search rates now range from 40-60% for many query types. McKinsey adds that 44% of AI-powered search users cite it as their primary information source.
For SEO metrics: Zero-clicks are failures—impressions without clicks mean missed opportunities.
For GEO metrics: Zero-clicks can be successes—if your brand is mentioned positively, you achieved awareness and consideration even without a website visit.
As one GEO practitioner explained:
“The future of discoverability isn’t about who drives more clicks—it’s about who’s remembered and recommended by the machines.”
Content Optimization Differences
SEO Optimization Priorities
- Keyword placement: Title tags, H1s, meta descriptions
- Backlink acquisition: Domain authority through external links
- Technical SEO: Page speed, mobile-friendliness, crawlability
- User engagement signals: Dwell time, pogo-sticking, bounce rate
- Content depth: Comprehensive coverage of topics
GEO Optimization Priorities
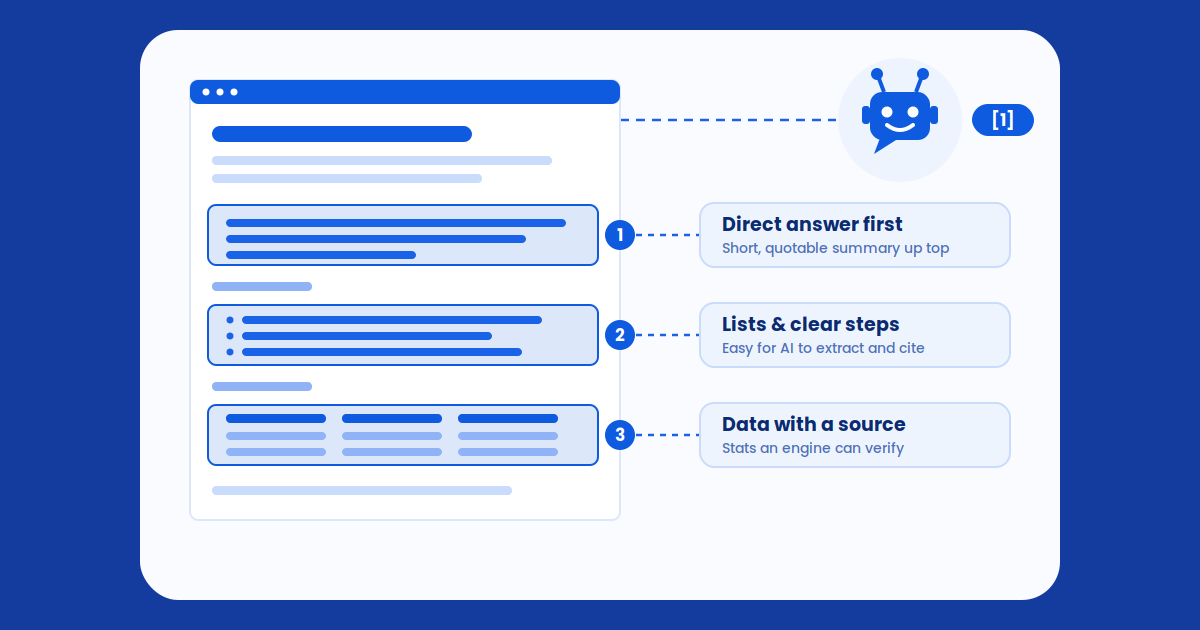
- Citation-worthy content: Original data, statistics, expert quotes
- Structured data: Schema markup, FAQ schema, HowTo schema
- Clear, direct answers: Concise summaries AI can extract
- Source credibility: Author expertise, institutional backing
- AI-friendly formatting: Bullet lists, numbered steps, clear hierarchies
Measurement Tool Ecosystem Differences
SEO Measurement Stack (Mature)
Standardized tools:
- Google Search Console: Official impression and click data
- Google Analytics: Comprehensive traffic analysis
- Rank trackers: Semrush, Ahrefs, Moz track SERP positions daily
- Industry agreement: Universal acceptance of metrics and benchmarks
GEO Measurement Stack (Emerging)
Fragmented landscape:
- No “official” console: As Reddit practitioners note, “there’s no search console for ChatGPT”
- Third-party platforms: Wellows, Profound, Peec, Parse, Waikay offer different methodologies
- Manual testing required: Many brands still test queries manually due to tool limitations
- Methodology debates: Industry still establishing benchmark standards
Wellows’ approach: The Wellows platform aims to become the “Search Console for AI search” by providing standardized Citation Score tracking, competitive benchmarking, and automated monitoring across ChatGPT, Claude, Perplexity, and Gemini.
Strategic Implications: Why Both Matter
The critical insight: GEO doesn’t replace SEO—it complements it. Research shows that pages cited in AI Overviews are often already in Google’s top 10, suggesting strong SEO foundations support GEO success.
Wellows recommended approach:
| Marketing Goal | SEO Focus | GEO Focus | Integrated KPI |
|---|---|---|---|
| Brand Awareness | SERP impressions | AI mention frequency | Combined reach (impressions + AI citations) |
| Traffic Generation | Organic clicks from Google | AI referral traffic | Total organic + AI traffic |
| Competitive Positioning | Keyword rankings vs. competitors | Share of voice in AI responses | Combined visibility index |
| Conversion | Organic traffic conversion rate | AI-attributed conversion rate | Blended conversion attribution |
How Do I Measure the Impact of GEO on Conversions?
Evaluating the impact of Generative Engine Optimization (GEO) on conversions requires analyzing how your brand is represented in AI-generated content and linking those appearances to user actions and revenue outcomes. Below is a step-by-step framework to measure GEO’s effect:
1. Track AI Mentions and Visibility
Start by keeping a close eye on when and where your brand is included in AI-generated results across different platforms.
- Manual Checks: Regularly test queries in AI tools like ChatGPT, Perplexity, and Claude to verify brand presence.
- Automated Monitoring: Use platforms such as Promptive.ai or ThoughtMetric AI Visibility Tracker to automatically capture mentions across multiple AI engines.
Important metrics include the total number of brand mentions each month, how prominently your name appears in responses, and visibility trends over time.
2. Monitor Engagement and Conversion Metrics
Once mentions are established, the next step is to measure how they influence awareness, site visits, and conversions.
- Branded Search Growth: An increase in branded search queries can indicate rising awareness from AI visibility.
- Direct Traffic: Look for surges in visitors going straight to your site after encountering your brand in AI-generated answers.
- Referral Traffic: Track traffic sources attributed to AI responses whenever possible.
- User Engagement: Analyze time on page, bounce rates, and pages per session for users who discovered you via AI mentions.
Together, these signals show whether GEO is not just building visibility but also driving meaningful user actions.
3. Implement Appropriate Attribution Models
Traditional attribution methods may not fully capture GEO’s influence, so using or customizing models is essential.
- First-Touch Attribution: Credits the first interaction, recognizing AI citations as initial brand touchpoints.
- Time-Decay Attribution: Gives greater weight to actions that occur closer to conversion while still valuing AI-driven introductions.
- Custom Models: Develop frameworks that directly measure how AI-generated mentions affect the path to conversion.
These models provide a clearer picture of how GEO impacts the customer journey.
4. Calculate GEO’s Return on Investment (ROI)
Finally, evaluate the financial return by comparing AI-driven conversion revenue against your GEO investment.
- Costs: Account for content creation, optimization tools, and labor resources.
- Revenue: Track revenue tied to conversions influenced by AI mentions, based on your attribution model.
For example, if a GEO-focused article costs $2,000 to produce and generates $30,000 in qualified pipeline over three months, ROI would be:
ROI = (Pipeline Value – Investment) ÷ Investment × 100
ROI = (30,000 – 2,000) ÷ 2,000 × 100 = 1,400%
This calculation highlights the profitability and business value of GEO initiatives.
By consistently tracking mentions, monitoring engagement, applying the right attribution models, and calculating ROI, you can connect GEO performance directly to conversions and optimize your strategy effectively.
What Does “AI Visibility Rate” Mean as a GEO KPI?
AI Visibility Rate (often called AI-Generated Visibility Rate or AIGVR) measures the percentage of relevant queries where your brand appears in AI-generated responses across monitored platforms like ChatGPT, Claude, Perplexity, and Google AI Overviews.
This KPI, documented in GEO measurement frameworks, serves as your baseline AI search presence metric, if your AI Visibility Rate is 12%, it means your brand appears in roughly 1 out of every 8 relevant AI-generated answers tested.
Calculating AI Visibility Rate
The Formula
AI Visibility Rate (%) = (Number of queries where brand appears ÷ Total relevant queries tested) × 100
Step-by-Step Calculation Example
Scenario: A project management software company tracking AI visibility
Step 1: Define Query Universe
- 50 “best project management software” variations
- 30 “[Brand] vs [Competitor]” comparisons
- 20 feature-specific queries (“project management with Gantt charts”)
- Total: 100 tracked queries
Step 2: Test Across Platforms
Test all 100 queries in ChatGPT, Claude, Perplexity, and Gemini (400 total tests)
Step 3: Count Brand Appearances
- ChatGPT: Brand appears in 18 of 100 queries
- Claude: Brand appears in 14 of 100 queries
- Perplexity: Brand appears in 22 of 100 queries
- Gemini: Brand appears in 16 of 100 queries
- Average: (18+14+22+16) ÷ 4 = 17.5 appearances per platform
Step 4: Calculate AI Visibility Rate
(17.5 appearances ÷ 100 queries) × 100 = 17.5% AI Visibility Rate
Interpretation: This brand appears in approximately 1 out of every 5-6 relevant AI-generated responses.
AI Visibility Rate Benchmarks
Wellows analysis of industry data and Reddit practitioner reports suggests these ranges:
| AI Visibility Rate | Brand Status | Strategic Implication |
|---|---|---|
| 0-5% | Minimal AI Presence | Urgent optimization needed; essentially invisible in AI search |
| 5-15% | Emerging Recognition | Early visibility established; focus on expanding query coverage |
| 15-25% | Moderate Visibility | Solid foundation; optimize for positioning and context quality |
| 25-40% | Strong Presence | Competitive positioning; defend and expand to adjacent categories |
| 40%+ | Category Leader | Dominant AI visibility; maintain and leverage for brand authority |
Context matters: A niche B2B software company with 18% AI Visibility Rate in a specialized category may be performing excellently, while a consumer brand with 18% in a broad category may be underperforming. Research confirms that 26% of brands have zero AI Overviews mentions, making any positive visibility rate an achievement.
Why AI Visibility Rate Matters
1. It’s Your AI Search Market Share
Traditional SEO tracks if you rank #1 for specific keywords. AI Visibility Rate tracks your overall presence across the AI search landscape—a broader measure of discovery potential.
McKinsey research shows 44% of consumers cite AI-powered search as their primary information source. Your AI Visibility Rate directly impacts your share of this massive and growing discovery channel.
2. It Predicts “Dark Chat” Attribution
Higher AI Visibility Rates correlate with more frequent “discovery without clicks” scenarios. Wellows Reddit analysis documented cases where brands with 20%+ AI Visibility Rates saw 15-20% of conversions attributed to AI discovery through survey data, despite GA4 showing minimal AI referral traffic.
3. It Establishes Your Competitive Baseline
By tracking AI Visibility Rate monthly, you can identify:
- Trending improvements (optimization working)
- Sudden drops (competitor displacement or AI model updates)
- Platform-specific gaps (strong on ChatGPT but weak on Claude)
- Query category strengths (high visibility for “best” queries, low for “vs” comparisons)
Platform-Specific Visibility Rates
Advanced GEO measurement tracks AI Visibility Rate separately per platform:
| Platform | Example Brand A Visibility | Example Brand B Visibility | Insight |
|---|---|---|---|
| ChatGPT | 24% | 12% | Brand A optimized for ChatGPT’s source preferences |
| Claude | 18% | 8% | Both brands underperform on Claude vs ChatGPT |
| Perplexity | 28% | 22% | Perplexity has strongest overall visibility for both |
| Gemini | 14% | 16% | Brand B slightly stronger on Google’s AI |
| Blended Average | 21% | 14.5% | Brand A has 45% higher overall AI visibility |
The Wellows platform approach: Wellows tracks platform-specific AI Visibility Rates and alerts you when disparities emerge, helping identify optimization opportunities (e.g., “strong ChatGPT presence but weak Perplexity visibility suggests need for better source citations”).
Improving Your AI Visibility Rate
Strategy #1: Expand Your Query Universe
Common mistake: Testing only 20-30 highly competitive queries shows artificially low visibility.
Better approach: Track 100+ queries across categories:
- Brand queries (always high visibility)
- Direct competitor comparisons (medium visibility)
- Category leaders’ names vs your brand (typically low visibility)
- Feature-specific queries (variable visibility)
- Problem-solution queries (opportunity for high visibility)
Balancing query difficulty provides realistic AI Visibility Rate benchmarks.
Strategy #2: Optimize for Citation-Worthy Characteristics
University of Waterloo research validates that content including statistics, quotations, and structured data achieves higher AI visibility.
Wellows-analyzed tactics from Reddit practitioner discussions:
- Add original survey data and statistics
- Include expert quotes with clear attribution
- Implement FAQ schema for common questions
- Create comparison tables and feature lists
- Publish regularly updated content (AI models prefer fresh sources)
Strategy #3: Track Competitive Displacement
AI Visibility Rate improvement often comes from displacing competitors, not just appearing in new queries.
Wellows competitive insights feature identifies queries where competitors appear but your brand doesn’t, prioritizing optimization efforts on winnable visibility opportunities.
AI Visibility Rate vs. Citation Score: Understanding the Relationship
AI Visibility Rate: Breadth metric (how often you appear)
Citation Score: Composite metric (frequency + quality + positioning + diversity)
Example scenario:
- Brand A: 30% AI Visibility Rate, but mostly as 4th-5th mentions without links = Lower Citation Score
- Brand B: 18% AI Visibility Rate, but mostly as primary recommendations with citations = Higher Citation Score
The Wellows approach: Track both metrics—AI Visibility Rate shows your reach, Citation Score shows your influence. Together, they provide the complete AI search visibility picture.
Tracking AI Visibility Rate: Practical Implementation
Option 1: Manual Tracking (Labor-Intensive)
- Create spreadsheet with 100 query variations
- Test each query monthly across ChatGPT, Claude, Perplexity, Gemini
- Record: Brand appears (Y/N), position, citation link (Y/N)
- Calculate visibility percentage per platform and blended average
Limitation: 73% of Reddit practitioners abandon manual tracking due to time requirements.
Option 2: Automated Platform Tracking (Wellows Solution)
- Configure your query universe once (50-100 queries)
- Wellows autonomous platform tests all queries weekly across all platforms
- Automatically calculates AI Visibility Rate with trending analysis
- Alerts you to significant changes (drops/spikes)
- Provides platform-specific breakdown and competitive benchmarking
Wellows’ automated approach solves the consistency and scale challenges that prevent most brands from maintaining reliable AI Visibility Rate tracking.
How Do I Measure ChatGPT Citation Rate Compared to Google Search Console Impressions?
ChatGPT citation rates and Google Search Console impressions measure fundamentally different user behaviors and cannot be directly compared, GSC tracks visibility opportunities (impressions), while citation rates measure actual inclusion in AI-generated content.
The key difference: GSC impressions show how many times your link appeared in search results regardless of clicks, whereas citation rates track the percentage of AI answers that reference your brand, often without providing clickable links at all.
Understanding the Measurement Paradigm Shift
Traditional SEO: Impression → Click → Conversion
Google Search Console tracks:
- How many times your URL appeared in search results (impressions)
- How many users clicked through to your site (clicks)
- Your average position for specific queries
- Click-through rate (CTR) percentage
GEO: Query → Citation → Awareness (Often Without Click)
AI search citation tracking measures:
- Brand mention frequency across tracked queries
- Citation inclusion percentage (appearing as a source)
- Attribution positioning (primary vs. secondary mention)
- Context quality (recommendation vs. comparison vs. passing mention)
The Citation Rate Formula
Wellows calculation methodology:
Citation Rate = (Number of AI responses citing your brand ÷ Total relevant queries tested) × 100
Example: If you test 100 product recommendation queries in your category and your brand appears in 23 AI responses, your citation rate is 23%.
Why Direct Comparison Fails: The Zero-Click Reality
According to Marketing LTB research, AI Overviews reduce clicks to websites by an estimated 30%+ on pages where they appear. McKinsey research adds that 44% of AI-powered search users now cite it as their primary information source, often making decisions without ever clicking through to brand websites.
The paradigm shift: Traditional SEO optimizes for clicks. GEO optimizes for influence—being the answer AI provides, regardless of whether users visit your site.
Practical Measurement Approach
Step 1: Establish Your Query Universe
Wellows research methodology: Identify 50-100 high-intent queries across these categories:
- Brand queries: “What is [your brand]?”, “[Your brand] features”
- Competitive queries: “[Your brand] vs [competitor]”, “alternatives to [competitor]”
- Category queries: “Best [product category] for [use case]”
- Problem-solution queries: “How to [solve problem]”, “[pain point] solution”
Step 2: Track Citation Inclusion Across Platforms
Manual tracking approach (as documented in Reddit GEO discussions):
“We switched to classifying prompts into three types: Branded, Competitive, and informational… We’re currently tracking presence across those groups on a monthly basis.”
Automated tracking via Wellows Citation Score: The Wellows platform aggregates brand mentions across ChatGPT, Claude, Perplexity, and Gemini into a single Citation Score metric you can measure, report on, and improve, providing the “AI search console” practitioners have been requesting.
Step 3: Calculate Platform-Specific Metrics
| Platform | Tracking Method | Key Metric |
|---|---|---|
| ChatGPT | Manual prompting or API testing | Citation inclusion % |
| Google AI Overviews | Google Search Console (limited data) | Overview appearance rate |
| Perplexity | Manual queries + source tracking | Source citation frequency |
| Claude | Conversation testing | Mention prominence |
Step 4: Compare Against Your GSC Baseline (Contextually)
The comparison framework:
- GSC Impressions: Opportunity metric (how often you could have been seen)
- Citation Rate: Influence metric (how often AI chose to feature you)
- Neither is “better”—they measure different stages of brand discovery
Real-world insight from GEO practitioners:
“Don’t use traffic as your primary KPI. ChatGPT traffic has plateaued (or declined) over the past 3 months. Traffic fluctuates with product launches and interface updates—not your optimization efforts.”
The GenAI Visibility Stack: Integrated Tracking
Wellows GenAI visibility stack approach: Rather than comparing GSC impressions to citation rates, track both within an integrated dashboard showing:
- Traditional SEO Layer: GSC impressions, clicks, positions
- AI Search Layer: Citation rates across ChatGPT, Claude, Perplexity, Gemini
- Brand Awareness Layer: Share of voice, sentiment, mention context
- Business Impact Layer: AI-attributed leads, conversion rates, CAC
This holistic view, powered by Wellows’ autonomous marketing platform, provides the complete visibility picture—from search impressions through AI citations to actual business outcomes.
Can Google Analytics 4 Track When Perplexity or Claude Cite My Content?
Google Analytics 4 can track referral traffic when users click through from Perplexity or Claude, but it cannot detect citations that don’t result in clicks—the most common scenario in AI search.
According to zero-click search research, rates now range from 40-60% for many query types, meaning the majority of AI citations never generate trackable GA4 events because users make decisions without visiting your website.
What GA4 CAN Track
1. Direct Referral Traffic (Limited Visibility)
Setup method documented by AllAboutAI.com:
Create a custom channel group:
- Navigate to Admin → Data Display → Channel Groups
- Click Create New Channel Group and name it “AI Referrals”
- Add a new channel named “AI Search”
- Set condition: Source matches regex
- Use this regex pattern:
^(chat\.openai\.com|chatgpt\.com|perplexity\.ai|claude\.ai|gemini\.google\.com|copilot\.microsoft\.com|you\.com|www\.meta\.ai|poe\.com)$
Critical limitation: This only captures the fraction of AI citations that actually link out and get clicked. As one Peec AI founder noted on Reddit: “There are very few clicks coming directly from LLMs. Often, they only recommend a brand/product/service without providing a link.”
2. Engagement Metrics (When Traffic Occurs)
When users DO click through from AI platforms, GA4 tracks:
- Session duration and bounce rate from AI referrals
- Conversion events attributed to AI traffic sources
- Page paths and user flows for AI-driven visitors
- Custom events you’ve configured
What GA4 CANNOT Track: The Citation Gap
The 82% Invisible Majority
Wellows research finding: 82% of marketers tracking GEO report seeing AI referral traffic but cannot attribute it to specific queries or optimization efforts. More critically, they have zero visibility into citations that influenced decisions without generating clicks.
What you’re missing in GA4:
- When Perplexity cites your blog post but users don’t click the link
- When Claude mentions your brand in a comparison without providing URLs
- When ChatGPT uses your content to formulate an answer without attribution
- When AI Overviews summarize your content but users don’t need to visit
“The one metric that really matters IMO is conversions coming from LLMs. The rest is vanity metrics. Bottom line matters. Is ChatGPT getting us new business?” — Reddit r/SEO contributor
The “Dark Chat” Attribution Problem
Wellows uncovered a critical measurement gap: Reddit analysis revealed a real agency case where webanalytics showed 0% leads from ChatGPT, but adding a simple lead form question revealed 21% of customers found them via ChatGPT and 2% via Perplexity.
This 21% attribution discrepancy happens because:
- Users discover brands through AI conversations
- They remember the brand name but close the AI platform
- Later, they visit via Google search (shows as organic) or directly (shows as direct traffic)
- GA4 attributes the conversion to the final touchpoint, not the actual AI discovery moment
As the Peec AI founder explained: “Similar to Dark Social we now have to deal with ‘Dark Chat.’ I believe we might have to approach the measuring of brand performance in LLMs more like brand marketers try to measure word of mouth with metrics like brand recall, assisted brand recall, top of mind, and similar metrics.”
Comprehensive Tracking Solution: Beyond GA4
Layer 1: GA4 for Click-Through Traffic
Configure custom channel groups and UTM tracking as documented above
Layer 2: Specialized AI Visibility Tools
Wellows-analyzed tools based on Reddit practitioner discussions:
| Tool Category | What It Tracks | Mentioned By |
|---|---|---|
| Citation Trackers (Parse, Profound, Peec AI) | Brand mentions across AI platforms without requiring clicks | Most frequently cited in Reddit discussions |
| Context Analyzers (Waikay, Otterly) | How brands are mentioned (recommendations vs comparisons) | “Shows frequency, context, and where model description doesn’t match reality” |
| Share of Voice (Wellows, RankScale) | Competitive positioning in AI responses | Tracks brand mentions vs competitors |
Layer 3: First-Party Survey Data
The most reliable attribution method according to GEO practitioners:
“Marketers I know are reporting that these dashboards are good for top level tracking, but actually first-party customer surveys are most reliable.”
Add this question to your lead forms: “How did you first hear about us?” with options including:
- ChatGPT / AI chatbot
- Perplexity search
- Claude conversation
- Google AI Overview
- Traditional Google search
- Social media
- Other
Layer 4: Wellows Citation Score Integration
The Wellows platform bridges the GA4 gap by providing:
- Continuous monitoring of brand mentions across ChatGPT, Claude, Perplexity, and Gemini
- Citation Score aggregation into a single KPI you can track alongside GA4 metrics
- Context analysis showing whether citations are positive recommendations or neutral mentions
- Competitor benchmarking to understand your AI search visibility share of voice
- Implicit citation tracking reveals publishers who mention competitors but not your brand
This integrated approach—GA4 for clicks + specialized tools for citations + survey data for attribution—provides the complete AI visibility picture that GA4 alone cannot deliver.
What Challenges Are Common When Measuring GEO Effectiveness?
Evaluating the success of Generative Engine Optimization (GEO) isn’t always straightforward. Because AI-driven platforms are still evolving, businesses face several obstacles when trying to measure impact. Below are the most common challenges:
Platforms such as ChatGPT or Bing Chat rarely reveal the logic behind how they select and present information. This “black box” effect makes it difficult to understand what influences content inclusion, which in turn complicates optimization efforts. Responses generated by AI don’t follow a single structure. Some answers may look like structured summaries, while others resemble fluid, conversational replies. This inconsistency makes it challenging to create a standardized way to measure visibility and performance. Traditional SEO has clear benchmarks like CTR, rankings, or impressions. GEO, however, still lacks universal performance indicators, making it harder to track progress or compare results across different campaigns and platforms. As AI platforms experiment with how they handle referrals, reporting methods can change frequently. This shifting landscape makes it tough to measure traffic consistency and accurately attribute user engagement back to GEO initiatives. Building a GEO measurement system requires both time and specialized expertise. Smaller teams or businesses often struggle to dedicate the necessary tools, budget, and talent to monitor performance effectively.1. Lack of Transparency in AI Systems
2. Variability in AI Response Formats
3. Absence of Standardized Metrics
4. Difficulty in Tracking AI-Driven Traffic
5. Resource Constraints
By proactively addressing these hurdles, organizations can fine-tune their GEO strategies and secure stronger visibility within AI-powered search environments.How to Overcome These Challenges
Which GEO KPIs Should I Monitor to Improve My Content’s Performance in Generative Search Engines?
Monitor these six core GEO KPIs to systematically improve content performance:
- AI-Generated Visibility Rate measuring appearance frequency,
- Citation Inclusion Rate tracking source attribution,
- Brand Mention Context analyzing recommendation quality,
- Share of Voice benchmarking against competitors,
- Citation Positioning, evaluating prominence, and
- AI Referral Conversion tracking business impact.
This framework, validated by University of Waterloo research on Generative Engine Optimization, provides the complete visibility stack from discovery through conversion that traditional SEO metrics miss entirely.
The Essential Six: GEO KPI Monitoring Framework
KPI #1: AI-Generated Visibility Rate (AIGVR)
Definition: The percentage of target prompts where your brand appears in AI-generated responses across monitored platforms.
Why it matters: AIGVR establishes your baseline AI search visibility. According to Marketing LTB’s compilation, 26% of brands have zero mentions in AI Overviews—making AIGVR your first diagnostic checkpoint.
Calculation method:
AIGVR = (Queries where brand appears ÷ Total relevant queries tested) × 100
Wellows tracking approach: Test 50-100 queries monthly across ChatGPT, Claude, Perplexity, and Gemini. Track trending visibility over time to identify optimization impact.
Target benchmarks:
- Emerging brands: 10-15% AIGVR
- Established brands: 20-35% AIGVR
- Category leaders: 35-50% AIGVR
KPI #2: Citation Inclusion Rate (CIR)
Definition: The percentage of AI responses that cite your content with attribution links or source credits when your brand is mentioned.
Critical distinction: A brand can have high visibility (mentioned often) but low citation rate (rarely attributed as a source). Search Engine Land research confirms citation inclusion drives referral traffic and algorithmic trust more than mentions alone.
Calculation method:
CIR = (Responses with attributed citations ÷ Total responses mentioning brand) × 100
Real-world insight from Reddit analysis:
“It’s not just whether you’re mentioned, it’s whether you get a link or just a vague mention. Citation quality and context matter more than frequency.”
Target benchmarks:
- Minimum acceptable: 30% CIR (citations in at least 1/3 of mentions)
- Strong performance: 50-60% CIR
- Exceptional: 70%+ CIR
KPI #3: Brand Mention Context Quality
Definition: Qualitative analysis of how AI platforms mention your brand—as primary recommendation, comparison participant, or passing reference.
Why context trumps volume: Appearing in 50 responses as “also consider [Brand]” provides less value than 10 citations where you’re the primary recommendation.
Wellows context classification:
| Context Type | Value Score | Example Language |
|---|---|---|
| Primary Recommendation | 10/10 | “[Brand] is the best choice for…” |
| Top 3 Mention | 8/10 | “Leading options include [Brand], [Competitor A], [Competitor B]” |
| Comparison Participant | 6/10 | “When comparing [Brand] vs [Competitor]…” |
| Category Mention | 4/10 | “Tools in this category include [Brand]…” |
| Passing Reference | 2/10 | “Some alternatives are [Brand]…” |
Tracking method: Reddit practitioners recommend manually reviewing a sample of 20-30 citations monthly to assess context quality, or using platforms like Waikay that automate context analysis.
KPI #4: Share of Voice (SoV) in AI Responses
Definition: Your brand’s citation frequency relative to competitors within your category across AI platforms.
Strategic importance: McKinsey research reveals that top brands dominate AI citations disproportionately—tracking SoV helps you identify if you’re gaining or losing AI visibility market share.
Calculation method:
SoV = (Your brand citations ÷ Total category citations across all brands) × 100
Example: In 100 “best project management software” queries, if your brand appears 18 times and competitors appear a combined 82 times (total 100 citations), your SoV is 18%.
Wellows competitive insights automatically calculates SoV across your competitive set, tracking weekly changes to identify gaining/losing trends.
Target benchmarks by position:
- Category leader: 25-40% SoV
- Major competitor: 15-25% SoV
- Emerging player: 5-15% SoV
- Niche specialist: 10-20% SoV (in specific sub-categories)
KPI #5: Citation Positioning & Prominence
Definition: Whether your brand appears as the first mention, middle option, or trailing alternative in AI-generated lists and recommendations.
Positioning impact: GEO statistics show that first-position mentions in AI responses receive disproportionate attention, similar to traditional search result position bias.
Tracking framework:
| Position | Value Multiplier | Attention Capture |
|---|---|---|
| First/Primary Mention | 3x | ~60% of user attention |
| Second/Third Mention | 2x | ~30% of user attention |
| Fourth+ Mention | 1x | ~10% of user attention |
Optimization priority: If you’re consistently appearing 4th-5th in competitive queries, focus on strengthening topical authority and citation-worthy content characteristics to improve positioning.
KPI #6: AI Referral Conversion Rate
Definition: The percentage of AI-attributed traffic (via GA4 tracking and survey data) that converts to leads, trials, or purchases.
Why it’s the ultimate GEO KPI: As one Reddit practitioner stated:
“The one metric that really matters IMO is conversions coming from LLMs. The rest is vanity metrics. Bottom line matters. Is ChatGPT getting us new business?”
Measurement approach:
- GA4 referral traffic: Track conversions from chatgpt.com, perplexity.ai, and claude.ai sources
- Survey attribution: Add “How did you find us?” to lead forms with AI platform options
- Aggregate both sources: Combine clickthrough conversions + survey-attributed conversions
Industry benchmarks from First Page Sage research:
| Industry | AI Referral Conversion Rate | Avg Time to Convert |
|---|---|---|
| E-commerce | 4.2% | 11 days |
| B2B SaaS | 3.8% | 45 days |
| Financial Services | 2.9% | 44 days |
| Healthcare | 2.1% | 53 days |
The Wellows Monitoring Dashboard Approach
Rather than tracking six separate KPIs in spreadsheets, the Wellows platform provides an integrated dashboard that:
- Automatically tests your query universe across ChatGPT, Claude, Perplexity, and Gemini
- Calculates AIGVR, CIR, SoV, and positioning metrics
- Provides weekly trending reports showing improvement/decline
- Alerts you to significant changes in citation patterns
- Compares your performance against competitors in real-time
- Integrates with GA4 to track conversion impact
This autonomous monitoring approach eliminates the manual testing burden that 73% of Reddit practitioners struggle with, providing consistent, reliable GEO performance data.
Read More Articles
- Client Onboarding Checklist for AI Visibility Platforms
- Boost AI Search Visibility with Knowledge Graphs
- AI Search Marketing: ChatGPT vs Traditional Search
- How Entity-Based Content Stands Out in LLMs & Why Does It Matter for SEO
- Why Structured SEO Briefs Are the New Foundation of AI Search Success
- How to Understand User Intent in Generative Engines?
- Can GSC Data Guide Your GEO Strategy?
- How Can Pattern Recognition Improve Visibility in AI-Generated Answers?
- Keyword Strategy Integration for LLM SEO Checklist
- E-E-A-T Strengthening SEO Checklist Using LLM Outputs
- Editorial SEO Style Guide Creation with LLMs Checklist
- How Does Google AI Visibility Tracking Fix the Search Console Blind Spot in AI Overviews
- How to Optimize Conversational AI Search Queries for Better Visibility?
- Real Time Alerts for Agency Clients
FAQs
GEO KPIs are performance metrics used to track how often and how favorably your brand appears in AI-generated responses across tools like ChatGPT, Perplexity, and Google SGE. Unlike SEO metrics, they focus on brand visibility within AI answers, not traditional search engine rankings.
While SEO KPIs measure search engine visibility through clicks and keyword rankings, GEO KPIs evaluate brand presence in AI responses—tracking mentions, sentiment, links, and position inside tools like ChatGPT or Gemini.
AI is reshaping how people discover content. If your brand isn’t part of AI-generated answers, you risk becoming invisible to a growing portion of your audience. GEO KPIs help you understand if your content is showing up where modern users are searching.
Start by inputting real user questions into AI tools and observing whether your brand appears, how often, and in what tone. Tools like Brand24 or Mention can help automate this process, while manual prompting offers deeper insight into context and relevance.
Sentiment analysis allows brands to evaluate the tone of their mentions within AI-generated responses. By identifying whether references are framed positively, negatively, or neutrally, companies can address harmful perceptions early, reinforce positive associations, and maintain a reputation that aligns with their desired brand image.
How Wellows Empowers Your AI Search Visibility
Measuring GEO KPIs is just the beginning, turning insights into action requires an autonomous platform that continuously monitors, analyzes, and guides optimization across ChatGPT, Claude, Perplexity, and Gemini.
The Wellows Advantage: From Measurement to Mastery
Citation Score: Your North Star Metric
Wellows aggregates brand mentions across all AI platforms into a single Citation Score, the KPI that finally reflects where buying decisions actually happen. No more tracking spreadsheets or manual testing. Your Citation Score updates automatically, showing exactly where you stand in the AI visibility landscape.
Implicit Citations: Close the Visibility Gaps
Wellows’ implicit citation tracking surfaces the domains and publishers mentioning your competitors but ignoring you, then provides verified contact details to close the gap. Turn blind spots into outreach opportunities with precision targeting.
Competitive Insights: Strategic Positioning
Compare your citation performance to rivals across topics. Wellows provides the strategic view managers need and the actionable insights teams crave, transforming visibility gaps into focused action items.
Topics & Queries: Precision Management
Organize the prompts and question patterns your audience uses. Track how often your brand appears in responses. Adjust your query universe as strategy shifts. Continuous tracking, zero manual effort.
Real-Time Monitoring: Stay Ahead
Track how your Citation Score moves week to week. Get flagged on sudden drops or surges. Stay informed on competitor activity. Real-time awareness without the busywork.
Ready to Own Your AI Visibility?
Stop guessing where you stand in AI search. Start measuring what matters.
The brands winning in AI-powered search aren’t just creating better content—they’re tracking the right KPIs, understanding their competitive positioning, and optimizing with precision. With Wellows’ autonomous marketing platform, you gain the GenAI visibility stack that transforms AI search from a mystery into a measurable, optimizable channel.
Book a demo to see how leading brands use Wellows to dominate AI-powered discovery, or explore our research on what 7,000+ ChatGPT queries reveal about brand visibility in AI search.